
Much has been written about the difficulties biotechnology and pharmaceutical companies (biopharma) have been experiencing in maintaining profitability. Gone are the halcyon days of marketing a me-too product with slight or no incremental benefit; relying on hoards of sales reps to garner sales with easy-to-see physicians. What happened since those good old days? Doctors are much harder to see, formularies and insurance programs place restrictions on use, patients are better informed on treatments, and generics represent 80% of prescriptions. It is my belief that though the future is challenging, it promises excellent upside potential for those companies that can maneuver and recreate themselves to overcome the obstacles now in place. Brief reviews, commentary, and quick recommendations to pursue to convert challenges into profitable opportunities follow.
The topics to be covered include:

Profitability - Is it Worth the Climb?
December 2012 key economic performance indicators data for the 215 industries tracked by Yahoo Finance show that "Drug Manufacturers-Major" has the highest Net Profit Margin of leading market capitalization industries (shown are the industries comprising 80% of total market capitalization as defined by Yahoo Finance).
| Major Integrated Oil & Gas | 118,841 | 4.2 | 14.2 | 3.486 | 26.629 | 2.06 | 6.5 |
| Money Center Banks | 116,140 | 11.3 | 6.7 | 2.333 | 78.238 | 1.24 | 10.2 |
| Business Equipment | 66,284 | 21.6 | 9.8 | 5.59 | 86.56 | -78.32 | 4 |
| Drug Manufacturers - Major | 54,679 | 17.2 | 15.8 | 3.695 | 85.112 | 19.89 | 16.7 |
| Industrial Metals & Minerals | 46,822 | 14.9 | 24.6 | 3.012 | 36.425 | 4.47 | 26 |
| Wireless Communications | 36,245 | 14.7 | 13.3 | 4.176 | 212.961 | 3.75 | 14 |
| Computer Based Systems | 31,536 | 13.1 | 14.1 | 5.085 | 153.507 | 3.14 | 6.4 |
| Multimedia & Graphics Software | 29,141 | 64.6 | 4 | 1.618 | 15.864 | 5.9 | 5.1 |
| Auto Manufacturers - Major | 26,006 | 25.3 | 7.9 | 1.783 | 123.398 | 1.78 | 2.9 |
| Diversified Machinery | 24,637 | 12.3 | 11.9 | 2.596 | 243.366 | 5.85 | 8.2 |
| Recreational Goods, Other | 17,661 | 32.2 | 12.1 | 0.342 | 110.282 | 5.03 | 5.1 |
| Aerospace/Defense - Major Diversified | 16,579 | 8.5 | 17.1 | 2.788 | 94.817 | -48.55 | 7.2 |
| Food - Major Diversified | 16,220 | 21.1 | 9 | 3.22 | 75.036 | -2.97 | 5.2 |
| Tobacco Products, Other | 13,999 | 18.7 | 8.1 | 3.169 | 263.765 | 1.07 | 2.2 |
| Conglomerates | 12,975 | 15.2 | 20.5 | 2.459 | 82.451 | 18.92 | 13.1 |
| Personal Products | 12,464 | 16.1 | 23.5 | 2.93 | 56.852 | -14.57 | 13.3 |
| Beverages - Wineries & Distillers | 12,428 | 18 | 24.1 | 2.633 | 129.253 | -22.74 | 17 |
| Diversified Utilities | 11,443 | 13.9 | 11.1 | 4.879 | 104.449 | 1.8 | 8.5 |
| Chemicals - Major Diversified | 11,188 | 17.4 | 19.6 | 3.101 | 60.499 | 10.03 | 7.6 |
| Information Technology Services | 10,644 | 22.5 | 11.7 | 1.891 | 9.924 | 8.37 | 5.6 |
| Asset Management | 9,545 | 17.5 | 10.3 | 2.54 | 71.982 | 4.51 | 9.7 |
| Independent Oil & Gas | 8,940 | 16.8 | 11.4 | 1.904 | 32.374 | 2.28 | 8.2 |
| Life Insurance | 8,933 | 15.8 | 9.4 | 2.288 | 77.015 | 1.32 | 4.7 |
| Oil & Gas Refining & Marketing | 8,865 | 14.1 | 15.3 | 2.243 | 383.132 | 2.08 | 3 |
| Beverages - Brewers | 8,272 | 17.9 | 20 | 1.534 | 57.619 | -12.03 | 20.3 |
| Business Services | 7,608 | 25.4 | 15.9 | 1.102 | 92.481 | -39.39 | 10.2 |
| Property & Casualty Insurance | 7,265 | 21.8 | 7.9 | 1.742 | 77.936 | 1.59 | 8.7 |
Within the health care industry sector, the "Drug Manufacturers - Major" segment maintains Net Profit Margin leadership. The margins for other segments are comparatively lower by significant multiples.
| Drug Manufacturers - Major | 54,679 | 15.8 | 3.70 | 16.7 |
| Drug Manufacturers - Other | 206 | 13.4 | 1.19 | 14.1 |
| Medical Appliances & Equipment | 1,700 | 14.1 | 1.76 | 13.7 |
| Medical Instruments & Supplies | 369 | 13.5 | 1.62 | 13.6 |
| Biotechnology | 4,533 | 8.7 | 2.13 | 11.9 |
| Drug Related Products | 20 | 14.9 | 1.31 | 9.5 |
| Specialized Health Services | 22 | 17.6 | 1.78 | 9.4 |
| Drugs - Generic | 1,291 | 7.6 | 0.13 | 6 |
| Home Health Care | 6 | 12 | 1.52 | 5.7 |
| Health Care Plans | 491 | 17.2 | 1.38 | 4.5 |
| Medical Practitioners | 3 | 12.7 | 8.78 | 4.3 |
| Hospitals | 511 | 144 | 0.07 | 4.3 |
| Diagnostic Substances | 13 | 2.5 | 1.76 | 2.7 |
| Long-Term Care Facilities | 28 | 2.4 | 0.51 | 0.9 |
| Medical Laboratories & Research | 104 | 1.5 | 1.19 | 0.8 |
| Drug Delivery | 892 | 0 | 0.31 | -1.2 |
Profitability, at least as measured in terms of Net Profit Margin, is comparatively high for Drug Manufacturers. For the industry to maintain this level of financial performance (that has come to be expected by Wall Street) has been the challenge for company leadership. Some of the most common responses by companies to this challenge have been:
- Mega-mergers with subsequent down-sizing to realize "synergies" (aka layoffs and site closures, and their attendant benefits)
- Sale of business units and/or products
- Co-marketing/co-promotion agreements
- In- and out-licensing
- Reduction/elimination of internal business processes/units, e.g., Research and Development, Clinical Operations, Sales Force
- Pipeline enrichment via innovation programs
- Focus on complex/orphan diseases
- Emerging markets, e.g., BRIC
- Embracing social media
- Increased focus on pricing and health economic outcomes
- Putting systems in place for interactions with Health Technology Assessment
agencies (HTAs)
Many of these reactions only provide short-term relief and do not address the fundamental challenges that require companies to reinvent themselves on a continual basis. Those companies that can evolve with the changing conditions will be able to maintain or exceed profitability goals.
Return to topics list

Epidemiology - Don't forget the basics!
Understanding a nation’s demographics and related disease epidemiology improves the understanding of populations at risk of disease and the potential need for medical treatment. Importantly to biopharma, demographics and disease epidemiology are also key drivers of the need for reforms in health care policies and related financing strategies. The evolution of health care reform and financing are key forces that biopharma needs to address and to adapt to in order to ensure future success. As neither demographics nor epidemiology are easily and quickly altered, biopharma must develop adaptive strategies to compete in the new environment being mindful of the opportunities these provide.
First, let's take a look at epidemiology.
Epidemiology is defined by Merriam Webster as:
- a branch of medical science that deals with the incidence, distribution, and control of disease in a population;
- the sum of the factors controlling the presence or absence of a disease or pathogen
HONDAs (patients who are/have Hypertension, Obesity, Non-compliant, Diabetics, Asthmatics) are a prime example of the importance of epidemiology in assessing the importance and corresponding value of treatment. This patient group reportedly accounts for 25% of patients but for 70% of health care cost. Obviously, any improvements made in pharmacological treatments and/or medical care practices that would change outcomes in these patient would have significant impact on health care costs.
Let's review just one treatment scheme for improving health for type 2 diabetics as an illustration of the opportunities for biopharma to provide value for both health care and branded products:
Sandra Tunis, in “Cost effectiveness of self-monitoring of blood glucose (SMBG) for patients with type 2 diabetes and not on insulin: impact of modeling assumptions on recent Canadian findings”, studied the benefit of SMBG in type 2 diabetes patients not on insulin, based on its potential to help manage glycemic control, and thereby reduce the risk for diabetes-related complications.
Study conclusions that are related to how challenges facing biopharma may be converted into opportunities:
- “Recent suggestions for optimization within clinical practice include improvements in information systems to ensure patients have access to HbA1c results, improvements in tools for interpretation, and improved strategies to enhance the patient health care professional collaboration.”
- “Economic evaluations able to capture SMBG effectiveness within the context of quality disease management will be critical for understanding its clinical benefit, and for providing evidenced-based inputs for modeling its overall longer-term value.”
The highlighted sections are potential areas of opportunity for pharma:
- Improvements in information systems: New or existing information systems could be coupled with biopharma company-developed communication systems to improve patients’ adherence to SMBG, their understanding of SMBG data, and enhancing/motivating a call to action, e.g., contacting physician, adjusting dose of medicine, and lastly, playing a role in providing appropriate treatment options and their delivery.
- Economic evaluations: The results of this study were highly dependent on assumption levels of a few variables in the economic model used in determining incremental cost-effectiveness ratios (ICERs)
(What is an ICER?).
- Pharma clinical programs could help to better understand and reduce the variability of these variables so as to enhance efforts in various health economic assessments (HEA) related to understanding the relationship of health, health outcomes, quality of life, and costs of treatment. Further, this understanding could then be used in providing relevant brand-specific health outcomes data to payers.
Return to topics list

Demographics - Hold on, the ball is already rolling downhill!
The world's population is 7.1 billion and that of the US is 315 million (4.5% of total world). Assuming that the ancient Mayan's prediction of the end of the world has safely passed us by, an understanding of the world's and the US' burgeoning populations and their characteristics are essential to developing current and future strategies both for biopharma and for all of us as citizens of the US and the world.
Aging and the Macro-economy: Long-Term Implications of an Older Population", published by the National Academies Press, provides an excellent analysis and assessment of population and its impact on the economy, health care, and way of life in the US.
The report states: "The aging of the U.S. population is the result of two long-term trends:
- People are living longer. Fifty years ago, average U.S. life expectancy was 67 years for males and 73 years for females; today, those numbers are 76 and 81.
- Birth rates are lower as many couples are choosing to have fewer children and to have those children somewhat later in life relative to previous generations
With people living longer and fewer children being born, it is virtually certain that the population will age substantially in the next few decades. Health at older ages has also improved over the last half century as disability rates have fallen, and many of the additional years that people are living are healthy ones.
There is already a very broad consensus that population aging will place fiscal pressure on the major government programs that help support older persons in this country. Social Security, Medicare, and Medicaid are on unsustainable paths, and failure to remedy this situation raises a number of economic risks (emphasis added). Health care costs per eligible person have been growing substantially faster than per capita income for decades, and if this pattern continues, it will interact with population aging to drive up public health care expenditures strongly. Recent reforms attempting to address this problem could lead to fundamental change in the delivery, quality, and cost of care, but their impacts are as yet unclear."
Their suggested options for resolution:
- Workers save more (and consume less) in order to prepare better
for their retirements
- Workers pay higher taxes (and thus consume less) in order to finance
benefits for older people
- Benefits (and thus consumption) for older people are reduced so as
to bring them in line with current tax and saving rates
- People work longer and retire later, raising their earnings and national
output
Assumably, the resolution of the problem will involve a mix of all four with their proportions being legislated and debated.
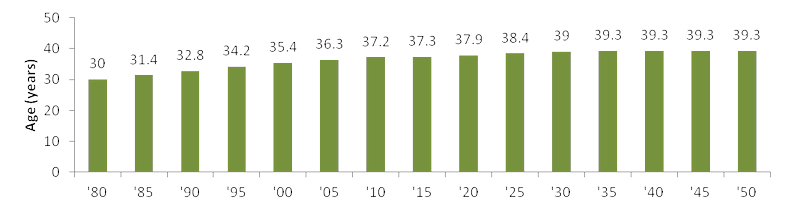
US Demographic Situation
An example of the importance of demographics and its impact on health care is the overall aging of the US and its implications related to health care provision, policies, and the Affordable Care Act (ACA).
US Census Department data show that the median age of the US will increase from 36 years of age in 2010 to 39 years of age in 2050:
Median Age in the US
Importantly, those aged 0-14 years as a percentage of those 65+ has been decreasing from 200% in 1980 to the current 144%, down to 114% in 2023 (a 20% decrease), and continues to decrease to 93% in 2050. Thus, more of the dependent population is being composed of those 65+ in age.
Note: “The average nonretired American now expects to retire at age 67, up from age 63 a decade ago, and age 60 in the mid-1990s.”; from Gallup's annual Economy and Personal Finance survey, conducted April 2012.
Young (0-14 years) as a Per Cent of The Elderly (65+ years) in the US, 1980-2050
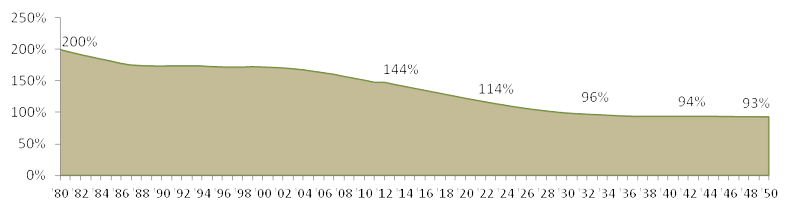
Moving forward, more of the US population will be composed of those over age 65 who have higher health care needs (a definite opportunity!).
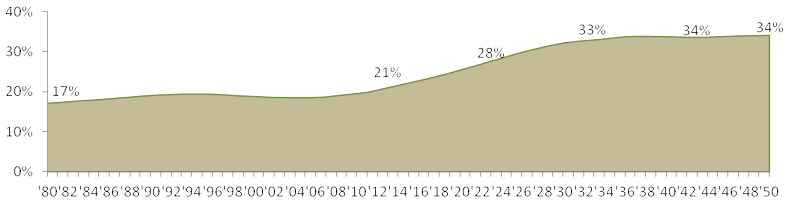
The dependency ratio is calculated by dividing the sum of those aged 0-14 and 65+ (in general, those not working and not paying much, if any, in taxes) by those aged 15-65 (theoretically those working and paying taxes). A high ratio generally means those of working age, and the overall economy, face a greater burden in supporting the aging population.
A key result of changes in demographics is an increase in the dependency ratio from 51% in 2013 to 66% in 2050:
US Dependency Ratio, 1980-2050

Ten years from now, the old-age dependency (ratio of those 65+ to those 15-64) increases 30% and increases by 57% by 2033.
US Old-Age Dependency Ratio, 1980-2050
Consider the implications of the dependency ratio increases and the changes in balance of age groups, coupled with the expansion of health coverage mandates set forth in the Affordable Care Act: more of the population will have higher health care needs with increased health care coverage being paid for by fewer people. The need for improving health care economics is apparent and urgent.
The aging population (those over age 65) is not a US-only phenomenon as seen in the figure below adapted from “World Population Aging 2009”, a 2009 United Nations’ report on world population aging.
Population Aged 60+: World and Development Regions, 1950-2050
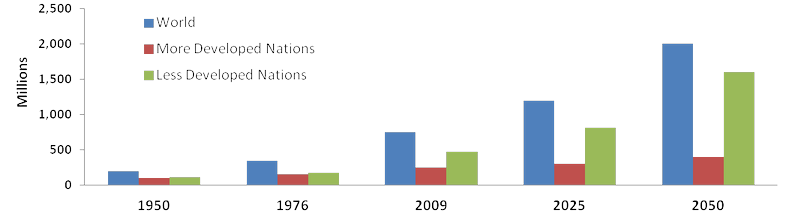
Some key conclusions from the UN report:
- The proportion of older persons in the world will double by 2050
- More developed regions have relatively high proportions of older persons
- High proportions of older persons in Europe; low proportions in Africa
- The older population is growing at a faster rate in the less developed regions
- In some countries, more than 40% of the population will be 60 years or over in 2050
- The older population will increasingly be concentrated in the less developed regions
- The median age in the more developed regions is more than 13 years higher than in the less developed regions, and 20 years higher than in the least developed countries
In summary, an assessment of the population projections for the next 25+ years suggests the following conclusions related to health care:
- The demand for health care will increase
- Greatest demand is by an expanding and increasingly aging population
- Expansion in the need for health care will be global in scope
- Health care demand will impact more-developed nations sooner than least-developed ones
Understanding the changing demographics as a key driver for payers and health care policy makers provides the rationale for their high level of motivation in ensuring that the health care systems they manage will get the most efficient health care for the budget resources allotted. Importantly, understanding this allows biopharma to develop clinical and commercial strategies and programs that will address the needs of payers and policy makers.
Return to topics list

Affordable Care Act (ACA) - What is Happening in 2013?
Before an update on the ACA, let’s take a brief look at where and how health care expenditures in the US compare to other countries that spend a lot on health, including countries with a lot of private insurance (Switzerland, France, and Germany), using data from the OECD's Health Indicators 2011 datasets.
Per capita spending in the US on health care, on a purchasing power parity (PPP) basis, is 1.5 to 2.7 times that of the surveyed countries.
Per Capita Spending on Health Care, US and Selected Countries (US$ PPP)
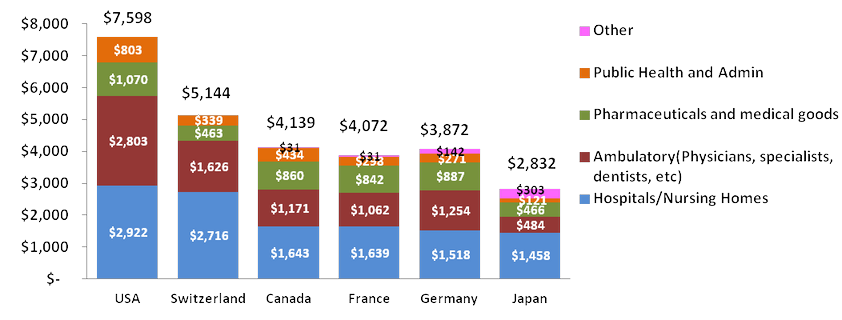
The OECD report states: “The growth in the various components of care reflects in part the relative stage of development of health systems. With inpatient care being highly labor intensive and therefore expensive, certain high income countries with developed health systems have sought to reduce the share of spending in hospitals by shifting to more day surgery, outpatient, or home-based care. However, this shift can also reflect regulatory issues. Public spending in the United States is largely Medicare- and Medicaid-related for which prices are tightly controlled. Thus, it can be in the interest of hospitals to shift patients to ambulatory care where there are no controls on the price of interventions. On the other hand, lower-income OECD countries seeking to invest in and expand their health systems have generally seen the growth in hospital inpatient care outpace other areas of spending such that it has been the main contributor to overall health expenditure growth.”
US Health Care Spending Per Capita vs. the Average of Selected Countries
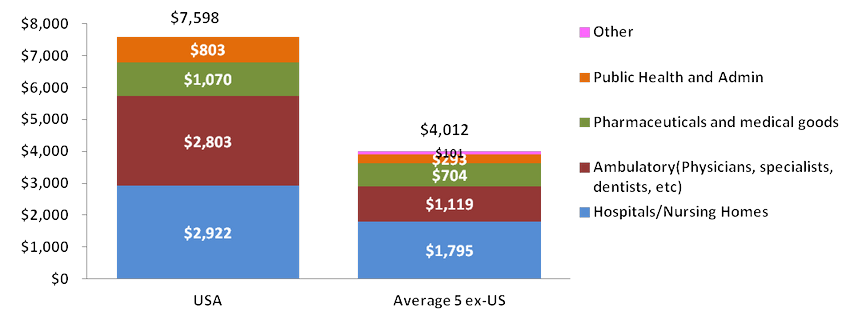
Total health care spending in the US is almost 200% that of the average of the five selected markets’ spending.
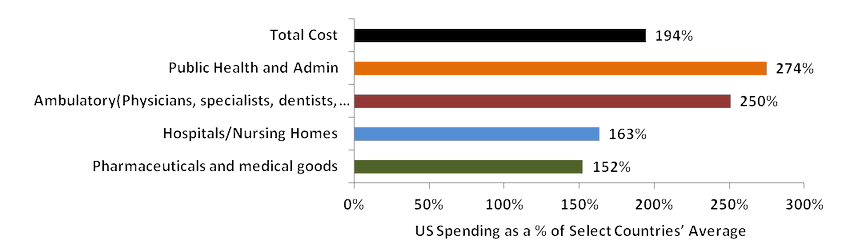
US Per Capita Health Care Spending as a Per Cent of Health Care Spending Average of Selected Countries
Why the Need for Reform in the US?
What has been driving the forces for health care reform in the US? One factor has been the significant disparity of health care costs in the US compared to those of other countries and the negative impact of costs on accessing health care. Data developed from the “2010 Commonwealth Fund International Health Policy Survey” illustrates the variation across countries of the percent of adults who said the cost of health care was responsible for problems accessing medical care.
Percent of Adults Who Had Any of Three Access Problems* in Past Year Because of Costs
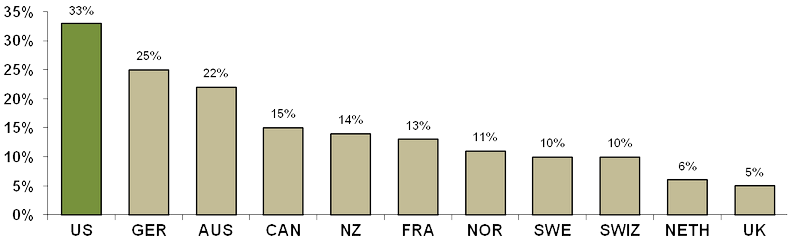
*Did not get medical care because of cost of doctor’s visit; skipped medical test, treatment, or follow-up because of cost; or did not fill Rx or skipped doses because of cost.
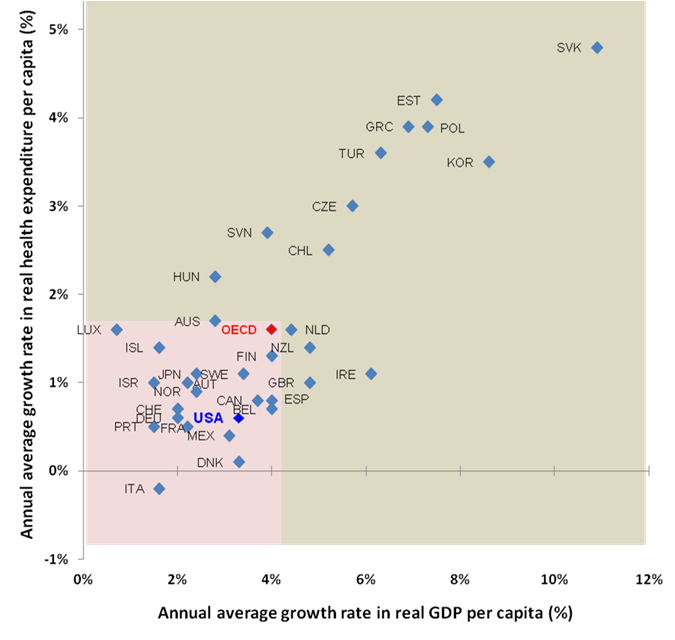
A bit off-topic, but the data I saw in the report provided an interesting perspective on assessing the health care market opportunities in different countries that can be derived from an assessment of: the annual average growth in real per capita spending on health compared to per capita GDP growth.
In the figure (which only captures OECD countries), the area shaded in tan would represent those markets with an above OECD average growth in per capita GDP and health care spending. It is logical to assume that countries that fall into this zone could represent higher than average markets of opportunity for investment in health care. It could be argued that these markets were in a maturation phase when these data were produced (2000-09) and that the growth phase has passed by. More diligence and more current data are obviously warranted but this could serve as a first-step filter in identifying markets with enhanced potential.
Annual average growth in real per capita expenditure on health and GDP, 2000-09 (or nearest year)
ACA - What is Happening in 2013?
A short list of key elements of the ACA and the projected timings for implementation from The Henry J. Kaiser Family Foundation and HealthCare.gov:
2010
- Some insurance market changes: No cost-sharing for preventive services, dependent coverage to age 26, no lifetime caps
- Pre-existing condition insurance plan
- Small business tax credits
- Premium review
2011-2012
- No cost-sharing for preventive services in Medicare and Medicaid
- Increased payments for primary care
- Accountable Care Organizations' formation encouraged
- Reduced payments for Medicare providers and health plans
- New delivery system models in Medicare and Medicaid
- Tax changes and new health industry fees
2013
- Medical Device Tax: The 2.3% excise tax on medical device revenue (not sales) is in effect January 1, 2013. See this for background.
- Improving Preventive Health Coverage: To expand the number of Americans receiving preventive care, the law provides new funding to state Medicaid programs that choose to cover preventive services for patients at little or no cost. Effective January 1, 2013. Learn more about the law and preventive care.
- Expanding Authority to Bundle Payments: The law establishes a national pilot program to encourage hospitals, doctors, and other providers to work together to improve the coordination and quality of patient care. Under payment “bundling,” hospitals, doctors, and providers are paid a flat rate for an episode of care rather than the current fragmented system where each service or test or bundles of items or services are billed separately to Medicare. For example, instead of a surgical procedure generating multiple claims from multiple providers, the entire team is compensated with a “bundled” payment that provides incentives to deliver health care services more efficiently while maintaining or improving quality of care. It aligns the incentives of those delivering care, and savings are shared between providers and the Medicare program. Effective no later than January 1, 2013.
- Increasing Medicaid Payments for Primary Care Doctors: As Medicaid programs and providers prepare to cover more patients in 2014, the Act requires states to pay primary care physicians no less than 100% of Medicare payment rates in 2013 and 2014 for primary care services. The increase is fully funded by the federal government. Effective January 1, 2013. Learn how the law supports and strengthens primary care providers.
- Providing Additional Funding for the Children’s Health Insurance Program: Under the law, states will receive two more years of funding to continue coverage for children not eligible for Medicaid. Effective October 1, 2013. Learn more about CHIP.
A current issue in ACA implementation is the notification by each US state on their decision regarding on how they will provide an insurance exchange.
From The Henry J. Kaiser Family Foundation’s tracking on this issue: “State-based health insurance exchanges, or marketplaces, are a key component of the Affordable Care Act (ACA), and the places where individuals and small businesses will be able to shop for coverage. States have the option of operating their own exchange or partnering with the federal government to run an exchange. States choosing neither option will default to a federally-facilitated exchange. All exchanges, regardless of how they are administered, must be ready to begin enrolling consumers into coverage on October 1, 2013 and must be fully operational on January 1, 2014.”
State Decisions for Creating Health Insurance Exchanges in 2014 (as of January 4, 2013)
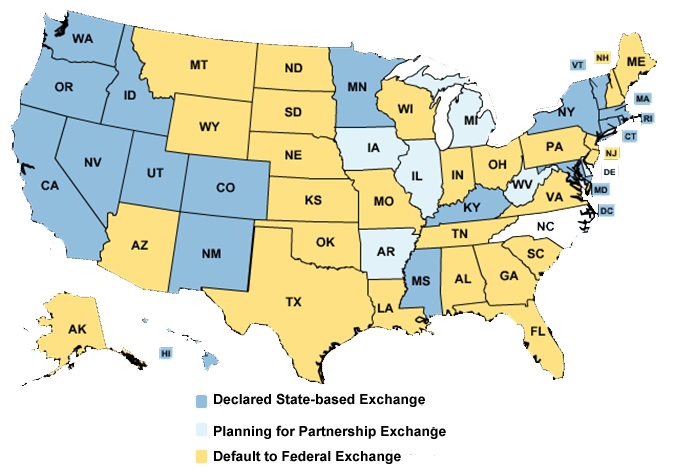
Note: Those states that have decided to default to the Federal Exchange (and mostly all other default positions) like Pennsylvania, have likely submitted an Exchange Planning Grant for funds to develop strategies, infrastructure, etc…to implement the exchange. The Budget Narrative for Pennsylvania is available here. The State requested over $38 million for the project with $23 million for consultants and third-party contractors for exchange planning and development. A potential opportunity for appropriate individuals and contractors!
2014
- Health Insurance Exchanges become operational
- Tax credits: To make it easier for the middle class to afford, insurance will become available for people with income between 100% and 400% (approximately $29K to $88K for a family of four) of the poverty line who are not eligible for other affordable coverage.
- Establishing the Health Insurance Marketplace: Starting in 2014 if your employer does not offer insurance, you will be able to buy it directly in the Health Insurance Marketplace. Individuals and small businesses can buy affordable and qualified health benefit plans in this new transparent and competitive insurance marketplace. The Marketplace will offer you a choice of health plans that meet certain benefits and cost standards. Starting in 2014, Members of Congress will be getting their health care insurance through the Marketplace, and you will be able buy your insurance through Marketplace too.
- Increasing the Small Business Tax Credit
- Medicaid expansion: Effective January 1, 2014, Medicaid will be expanded to include individuals between the ages of 19 up to 65 (parents, and adults without dependent children) with incomes up to 138% FPL based on modified adjusted gross income. Americans who earn less than 133% of the poverty level (approximately $14,000 for an individual and $29,000 for a family of four) will be eligible to enroll in Medicaid. States will receive 100% federal funding for the first three years to support this expanded coverage, phasing to 90% federal funding in subsequent years. Effective January 1, 2014.
- Insurance market rules: Prohibition on denying coverage or charging more to those who have a pre-existing condition or gender; eliminating annual limits on coverage; standardized benefits
- Individual coverage mandate: Fee for those not securing health insurance coverage unless a waiver is granted.
- Employer requirements: The law implements the second phase of the small business tax credit for qualified small businesses and small non-profit organizations. In this phase, the credit is up to 50% of the employer’s contribution to provide health insurance for employees. There is also up to a 35% credit for small non-profit organizations.
- Coverage for Individuals Participating in Clinical Trials: Insurers will be prohibited from dropping or limiting coverage because an individual chooses to participate in a clinical trial. This applies to all clinical trials that treat cancer or other life-threatening diseases.
- First IPAB recommendations: Independent Payment Advisory Board (IPAB)is a fifteen-member US Government agency created in 2010 by the Patient Protection and Affordable Care Act tasked with achieving specified savings in Medicare and limiting growth without affecting coverage or quality.
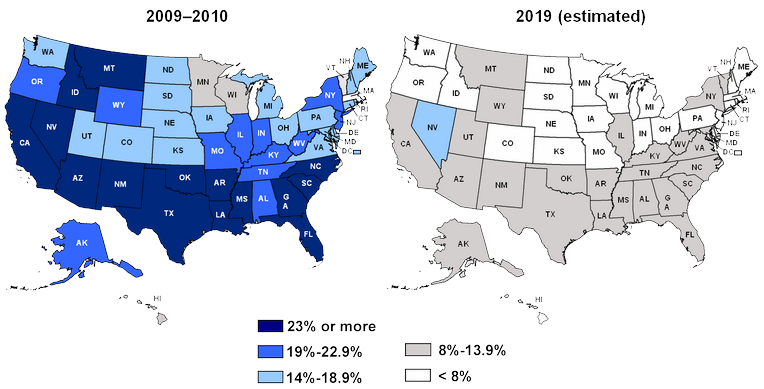
The fundamental and most beneficial outcome of the ACA to biopharma will be that over time, the percentage of adults in the US without health insurance will dramatically decrease as shown below. The increase in number of covered adults should increase access to and acceptance of medical treatment; thus, an increase in market potential for all products.
Pre- and Post-Reform: Projected Per Cent of Adults Ages 19–64 Uninsured, by State
How the changes in coverage are developed and implemented is still evolving, with continued and spirited debate between opponents and supporters.
Fundamentally, the ACA should provide biopharma with opportunities to market medicines and developing treatment options for an expanded target population that should be more willing and able to accept and afford therapy.
Return to topics list
Summary: Improving the Odds of Winning
- Secure a firm understanding of product-related epidemiology and demographics
- Develop products that offer significant medically-valuable differentiation and have a sustainable and realistic value proposition. No me-toos!
- Ensure that the clinical program develops data that will successfully drive pricing and reimbursement and support differentiable marketing.
Contact Partners in BioPharma Consulting to see where we can assist you with developing or assisting you and your organization with responding proactively to these changes in the environment. We can develop solutions, manage a project from beginning to end, provide contracted support, or suggest talented experts from our alliance partners to help you achieve your goals. Click here for an outline of services that can be aligned to meet your needs.
Links to Topic Information

The following links provide additional background and insights on the topics discussed in this newsletter. I hope you find them useful!
Return to topics list
